![[Metro Detroit Real Estate 2020]](https://jknorber.com/wp-content/uploads/2022/04/eXpRealty.jpg)
Enjoy this Metro Detroit Real Estate Market Report for this month. You can also do a home search and save your favorite properties. Set up a search and be alerted as soon as a matching property hits our database. It’s Exclusive.
Other’s have favored our Just Listed Homes with Map!
Metro Detroit Real Estate News
- What are the Average Detroit Real Estate Prices?
- Metro Detroit Housing Market Predictions 2018
- Newest Metro Detroit Homes For Sale
- Average Price Range by County
- Existing Single Family Home Sales Year to Date
- Existing Condo Sales Year to Date
- Average Time on Market for Metro Detroit Listings
- Active Number of Listings in Metro Detroit for the past 5 years through 2017
- Average List to Close Price
- Real Estate Statistics
- Oakland County Median Price Range (past 5 years)
- Macomb County Market Values
- Wayne County Housing Market
- Livingston Market Values
- Metro Detroit Market Reports from 2018
- Oakland County Market Reports
- Market Reports from 2017
- Metro Detroit Homes For Sale by Price and Feature
- Year-to-Year Comparison of Residential Homes Median Sales Prices
- Year-to-Year Comparison of Condo Median Sales Prices
- Metro Detroit Waterfront Homes For Sale
What are the Average Detroit Real Estate Prices?
Metro Detroit Single Family Homes ended 2017 with an average price of $191,146.
| Primary Year | Sale Price, Average |
|---|---|
| 2013 | $135,123 |
| 2014 | $149,936 |
| 2015 | $166,351 |
| 2016 | $177,695 |
| 2017 | $191,146 |
Metro Detroit Housing Market Predictions 2018
This month’s Metro Detroit Real Estate Market for July 2018 continues to hold down frustrated Buyers while Sellers still see a shining bright spot: Homes for sale inventory is down 19.8% from 2017 and, with fewer homes selling, the median sales price is up 7.0%.
The chatter about housing price bubbles has increased this summer, as observers attempt to predict the next shift in the residential real estate market. It is far too early to predict a hard shift away from higher prices and lower inventory, but the common markers that caused the last housing market downturn are essentially present…demand is still outpacing what is available for sale in many markets.
— Realcomp II, LTD.
July saw a total of 8,921 condominiums and single family homes sell throughout the multiple listing service. Comparing the number of sales last year for July 2017, this is up 3.3% for single-family homes, and up 8.3% for condos. Read More Here!
Newest Metro Detroit Homes For Sale
Average Price Range by County
Metro Detroit Home Sale Averages for each county for last year ending in 2017. These price averages are for single family homes only.
| County | Sale Price, Average |
|---|---|
| Livingston | $268,850 |
| Oakland | $255,993 |
| Macomb | $168,642 |
| Wayne | $132,649 |
Existing Single Family Home Sales Year to Date
Here are the latest number of home sales in Metro Detroit. These statistics are based on the counties of Oakland, Wayne, Macomb and Livingston.
Other’s have favored our detailed Oakland County Market Report.
| Month | Sales, Number of |
|---|---|
| Jan | 3,306 |
| Feb | 3,185 |
| Mar | 4,126 |
| Apr | 4,320 |
| May | 5,036 |
Existing Condo Sales Year to Date
| Month | Sales, Number of |
|---|---|
| Jan | 697 |
| Feb | 685 |
| Mar | 952 |
| Apr | 1,041 |
| May | 1,133 |
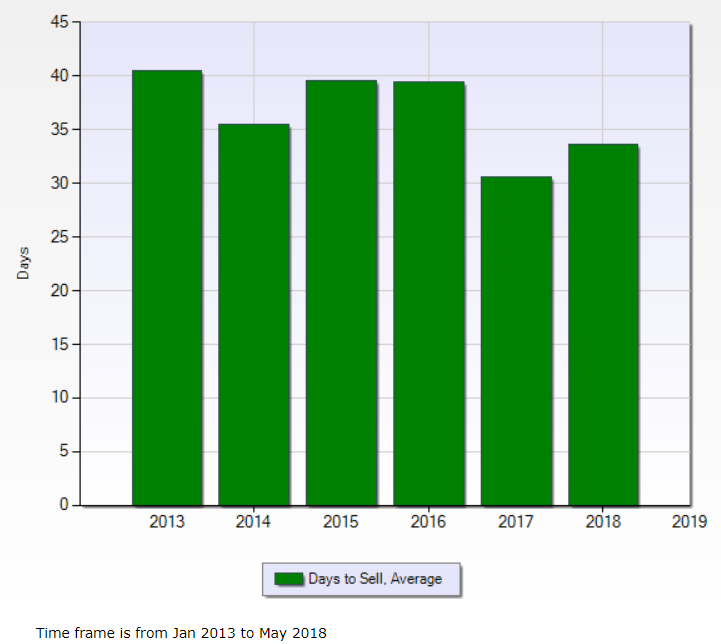
Average Time on Market for Metro Detroit Listings
At the end of 2017, the average days on market was 31 days, and up through May 2018, it takes an average 34 days to sell a house in Metro Detroit.
Active Number of Listings in Metro Detroit for the past 5 years through 2017
At the beginning of June 2018, there are currently 9,235 single family homes on the market, leaving 671 less Metro Detroit properties for sale than this time last year.
| Active Listings, Number of | ||||||
|---|---|---|---|---|---|---|
| Month | 2013 | 2014 | 2015 | 2016 | 2017 | 2018 |
| Jan | 16,518 | 18,464 | 18,478 | 13,435 | 9,761 | 8,636 |
| Feb | 15,788 | 18,286 | 18,020 | 12,939 | 9,294 | 8,194 |
| Mar | 15,092 | 18,445 | 18,945 | 12,518 | 9,119 | 7,912 |
| Apr | 15,615 | 20,269 | 21,019 | 12,477 | 9,008 | 8,380 |
| May | 16,255 | 21,352 | 22,397 | 13,132 | 9,906 | 9,235 |
| Jun | 15,227 | 23,219 | 23,599 | 13,590 | 10,887 | |
| Jul | 16,547 | 24,073 | 24,140 | 13,825 | 11,543 | |
| Aug | 17,382 | 23,534 | 23,827 | 14,108 | 11,939 | |
| Sep | 18,160 | 23,639 | 20,978 | 13,686 | 11,749 | |
| Oct | 19,372 | 23,042 | 17,279 | 12,796 | 11,350 | |
| Nov | 21,019 | 21,410 | 16,215 | 11,662 | 10,502 | |
| Dec | 18,832 | 19,274 | 14,542 | 10,159 | 9,306 | |
Average List to Close Price
At the end of 2017, the average list to close price was 99.1% indicating a strong seller’s market.
Real Estate Statistics
The REALTORS® Confidence Index (RCI) survey gathers monthly information from REALTORS® about
local real estate market conditions, characteristics of buyers and sellers, and issues affecting
homeownership and real estate transactions. The National Association of Realtors® (NAR) report presents key results about market transactions from February 2018.
- 37 Median Days on Market
- 2.2 Average Number of Offers Written per Client
- 29% of Residential Sales were 1st Time Home Buyers
- 24% Cash Sales
- Twenty-one percent of sellers offered incentives such as paying for closing costs (nine percent),
providing a warranty (nine percent), undertaking remodeling (three percent), and providing appliances (one percent). - Sales of distressed properties (foreclosed or sold as a short sale) accounted for four percent of sales.
- REALTORS® report “low inventory” and “interest rate” as the major issues affecting transactions in
February 2018.
Oakland County Median Price Range (past 5 years)
The Median Price range for single family homes in Oakland County, MI at the end of 2017 was $221,000, and through May 2018 is $230,000.
| Primary Year | Sale Price, Median |
|---|---|
| 2013 | $149,900 |
| 2014 | $168,750 |
| 2015 | $182,000 |
| 2016 | $200,000 |
| 2017 | $221,000 |
| 2018 | $230,000 |
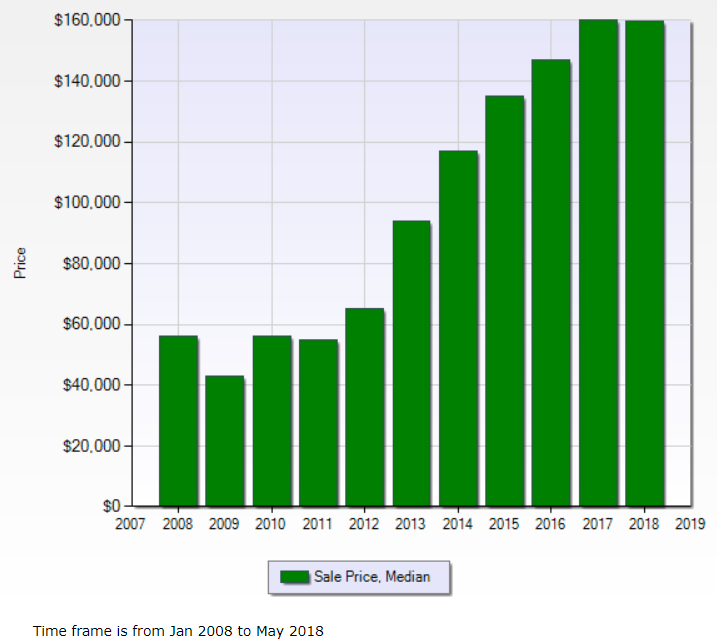
Macomb County Market Values
The Median Price range for single family homes in Macomb County, MI at the end of 2017 was $153,000, and through May 2018 is $155,000.
| Primary Year | Sale Price, Median |
|---|---|
| 2013 | $93,000 |
| 2014 | $114,900 |
| 2015 | $128,000 |
| 2016 | $140,000 |
| 2017 | $153,000 |
| 2018 | $155,000 |
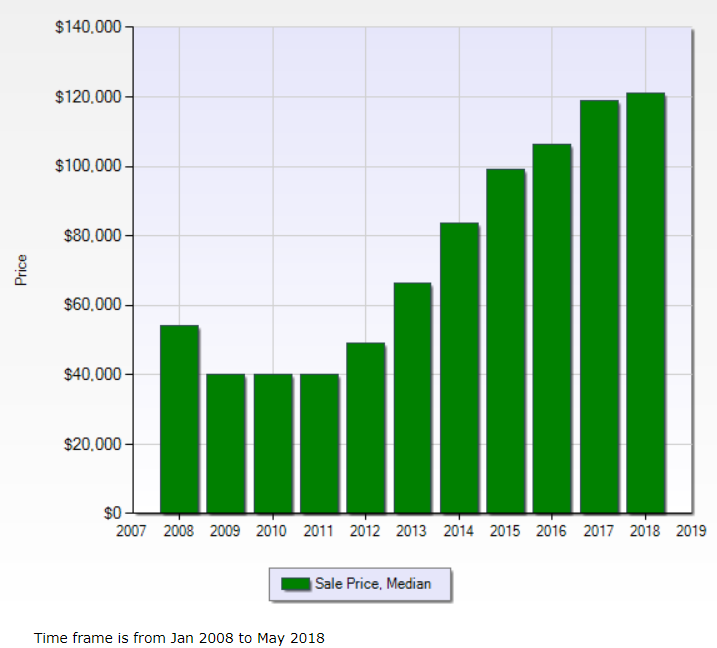
Wayne County Housing Market
The Median Price range for single family homes in Wayne County, MI at the end of 2017 was $104,900, and through May 2018 is $105,301.
| Primary Year | Sale Price, Median |
|---|---|
| 2013 | $49,900 |
| 2014 | $63,000 |
| 2015 | $81,500 |
| 2016 | $90,000 |
| 2017 | $104,900 |
| 2018 | $105,301 |
Livingston Market Values
The Median Price range for single family homes in Wayne County, MI at the end of 2017 was $250,000, and through April 2018 is $259,000.
| Primary Year | Sale Price, Median |
|---|---|
| 2013 | $178,000 |
| 2014 | $199,900 |
| 2015 | $215,000 |
| 2016 | $235,000 |
| 2017 | $250,000 |
| 2018 | $259,000 |
Metro Detroit Market Reports from 2018
Oakland County Market Reports
Market Reports from 2017
Metro Detroit Homes For Sale by Price and Feature
Wondering what your home might be worth? Find out instantly with our 15-second home value calculator.
Year-to-Year Comparison of Residential Homes Median Sales Prices
Year-to-Year Comparison of Condo Median Sales Prices
Metro Detroit Waterfront Homes For Sale
Here are homes for sale on the water in Metro Detroit and the Lakes Area.
| Search Homes for Sale in Metro Detroit Counties | |||
|---|---|---|---|
| Oakland County | Wayne County | Washtenaw County | Macomb County |
| Livingston County | Lapeer County | St. Clair County | |
WHAT IS MY METRO DETROIT HOME VALUE