![[Metro Detroit Real Estate 2020]](https://jknorber.com/wp-content/uploads/2022/04/eXpRealty.jpg)

Get Your Free, Instant Estimate
In this Oakland County Market Report, you’ll find the average home price, months of inventory, list to close ratio, average prices per square foot, the total number of sales and listings, volume of sales and listings and more information you might use in a real estate decision for the area. Please call Joshua Norber Team at 248-785-3737 to buy or sell real estate in Oakland County or Metro Detroit.
You can view the entire Metro Detroit Real Estate Market Report Here.
- Demographics
- Things to do
- Market Highlights
- Recent Homes Sales
- Active Listing Volume
- Close Price to List Price Ratio
- Average Days to Sell
- Expired Listings
- List Price by Sq Ft Ratio
- Average List Price
- Median List Price
- Months of Inventory
- Number of New Listings
- Median Sales Price
- Sales Volume
- Total Sales
- Recent Listings in Oakland County
Demographics
Oakland County, Michigan encompasses 907 square miles and is home to 1.242 million people as of 2015. With hundreds of lakes and waterways, Oakland County offers excellent waterfront living, all sports lakes, lake access and canal housing along with a myriad of outdoor and water-based activities. Oakland County is the highest-income Michigan location by per capita income.
Things to do
Market Highlights
The Oakland County Real Estate Market has continued to decrease the number of homes for sale while buyer demand remains strong. This resulted in 1,231 single family homes sold for March 2018, and 384 condominiums sold. This is a -5.5% decrease in homes sold and -4.4% increase in condos. Oakland County median price range increased 4.4% from March 2017 to $250,500 with single-family homes sales averaging $302,401 during March 2018.
Recent Homes Sales
For more information on recent home sales in Oakland County, contact Joshua Norber or call 248.785.3737.
Find Out What Your Home is Worth Now – FREE INSTANT HOME CALCULATOR
Active Listing Volume
| Month | Active Listings, $ Volume |
|---|---|
| Jan | $1,687,831,491 |
| Feb | $1,680,599,785 |
| Mar | $1,789,703,755 |
| Month | Active Listings, Number of |
|---|---|
| Jan | 3,873 |
| Feb | 3,701 |
| Mar | 3,625 |
Close Price to List Price Ratio
| Month | Close Price to List Price Ratio |
|---|---|
| Jan | 98.7% |
| Feb | 98.5% |
| Mar | 99.7% |
Average Days to Sell
| Month | Days to Sell, Average |
|---|---|
| Jan | 40 |
| Feb | 45 |
| Mar | 40 |
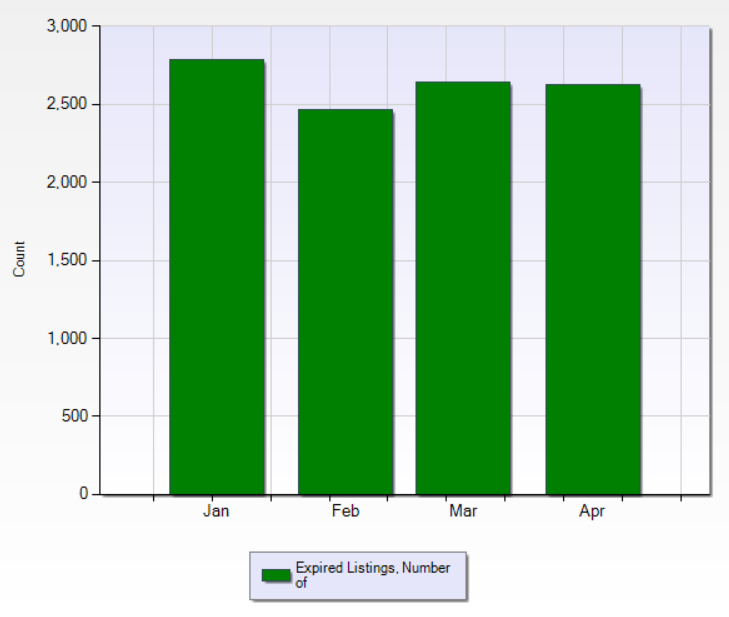
Expired Listings
| Month | Expired Listings, Number of |
|---|---|
| Jan | 2,786 |
| Feb | 2,465 |
| Mar | 2,645 |
How does a listing expire in a Seller’s Market?
There are many reasons that cause homes not to sell. There could be competition in the neighborhood that is priced more attractive or that shows better. Sometimes the best features of a home are not highlighted, and this means missed opportunities. Homes with pets or renters can present a host of problems. I find in many of our Metro Detroit areas that homes that are not updated or cluttered are very common.
If you’ve had your home for sale and you’re frustrated not selling it, the most likely answer is you need a more experienced agent. Let Joshua Norber know right away or call 248.785.3737 now.
List Price by Sq Ft Ratio
| Month | List Price by SqFt Ratio |
|---|---|
| Jan | $131 |
| Feb | $138 |
| Mar | $149 |
Average List Price
| Month | List Price, Average |
|---|---|
| Jan | $302,914 |
| Feb | $319,969 |
| Mar | $354,343 |
Median List Price
| Month | List Price, Median |
|---|---|
| Jan | $229,500 |
| Feb | $234,900 |
| Mar | $259,900 |
Months of Inventory
| Month | Months of Inventory |
|---|---|
| Jan | 3 |
| Feb | 3 |
| Mar | 2 |
Number of New Listings
| Month | Number of New Listings |
|---|---|
| Jan | 2,201 |
| Feb | 2,127 |
| Mar | 3,113 |
Median Sales Price
| Month | Sale Price, Median |
|---|---|
| Jan | $179,900 |
| Feb | $184,750 |
| Mar | $195,000 |
Sales Volume
| Month | Sales, $ Volume |
|---|---|
| Jan | $279,327,683 |
| Feb | $305,198,674 |
| Mar | $413,123,014 |
Total Sales
| Month | Sales, Number of |
|---|---|
| Jan | 1,297 |
| Feb | 1,362 |
| Mar | 1,787 |
Recent Listings in Oakland County
If you enjoyed the April Oakland County Market Report, you may like the April 2018 Market Report for Metro Detroit.